
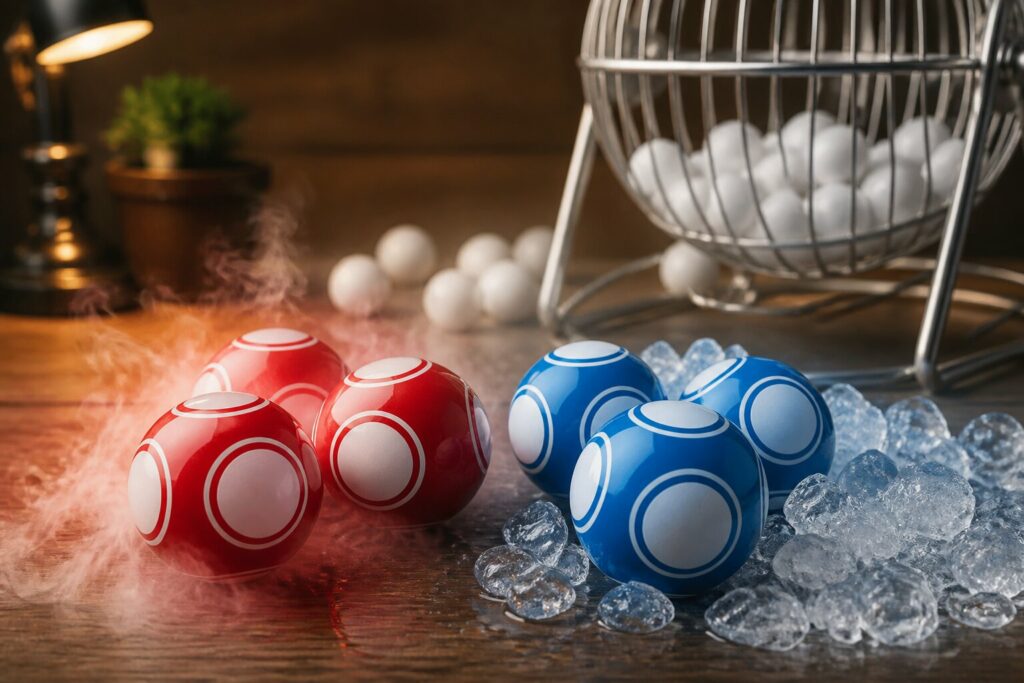
Set for Life Hot and Cold Numbers: Full List by Draw Frequency
Ever wondered which numbers appear most often in Set for Life draws, or which ones rarely show up? Many players enjoy tracking patterns in past results to add interest to the game and to inform their number choices.
Below you’ll find a full list of hot and cold numbers based on draw frequency, plus clear explanations of how those figures are calculated and what they do — and don’t — mean. Read on to see which numbers top the charts and which sit at the bottom.
What Are Hot and Cold Numbers in Set for Life?
Hot and cold numbers are simply labels for how often certain numbers have been drawn over a chosen period. Hot numbers are those with the highest counts in past results; cold numbers are those with the lowest. For Set for Life we record both the main balls and the Life Ball, then total each number’s appearances.
These terms describe historical frequency only — they do not imply a number is more or less likely to appear in future draws. Each draw is an independent event and every valid number starts each draw with the same chance of being selected. Understanding this helps keep expectations realistic when looking at the full list of frequencies.
The section that follows explains exactly how those frequencies are calculated and where the figures come from, so you can see the method behind the numbers.
How Is Draw Frequency Calculated?
Draw frequency is a straightforward tally: for a chosen timeframe we review each official draw, note the main balls and the Life Ball, and add one to the count for every time a number appears. The starting point can be the game’s launch, a recent year, or any other period selected for analysis.
This produces a clear numeric record for every number. For example, if number 8 appears in ten main-ball draws and twice as the Life Ball within the selected window, its total frequency reflects those appearances. The result is a snapshot of past outcomes rather than a predictive model.
With the calculation method understood, the next section shows how those totals are presented in the full list and what the order of numbers tells you.
Understanding the Full List of Hot and Cold Numbers
The full list ranks every number by the number of times it has been drawn within the chosen period, placing the most frequent at the top and the least frequent at the bottom. This ranking highlights which numbers have appeared often and which have not, but it is a historical record only.
Each entry typically shows the number and its total appearances; some lists break this down into main-ball and Life Ball counts for extra clarity. When interpreting the list, remember it reflects what has already happened and is useful primarily as a reference for past patterns.
Next, we look at specific examples from recent statistics to illustrate which numbers currently sit at the top and bottom of the frequency table.
Which Set for Life Numbers Are Drawn Most Often?
Based on recent tallies, certain main numbers have appeared more frequently than others. In the current dataset the most common main numbers include 3, 8, 15, 28 and 34. For the Life Ball, numbers such as 5 and 8 have shown higher appearance counts compared with their peers.
These figures come from counted results over the selected timeframe and are presented so you can see which numbers have stood out historically. Frequency can change over time as more draws are added, so these observations reflect past occurrences within the chosen sample rather than any future outcome.
The following section does the opposite, showing those that have appeared least often.
Which Set for Life Numbers Are Drawn Least Often?
At the other end of the list are the least-drawn, or “cold”, numbers. In the latest data the main numbers with the lowest counts include 6, 14, 18, 33 and 46. For the Life Ball, 1 and 9 have recorded fewer appearances than other Life Ball numbers. These figures simply reflect past draws and do not indicate that those numbers are any less likely to be selected in future draws.
Seeing the full spread from most to least frequent gives a complete picture of past outcomes. It can be interesting to spot which numbers have been quieter, and that information may help players who prefer to consider historical patterns when choosing numbers. However, it is important to remember that each draw is independent and governed by random chance, so frequency alone should not be taken as a reliable guide to future results.
After that, it is useful to consider how much weight these patterns should carry when choosing numbers. Some people prefer to avoid cold numbers, while others deliberately pick them in the belief they might be due. Either approach is a matter of personal preference and neither changes the underlying probabilities of the game.
Are Hot and Cold Number Patterns Reliable?
Hot and cold patterns are interesting as a record of past draws, but they are not reliable predictors of future results. Lottery and gambling draws are random events, and each draw is independent. That means a number’s past frequency does not change its chance of appearing next time, so reading too much into recent streaks can be misleading.
Using frequency lists as a form of entertainment or as one of several non-systematic ways to pick numbers helps keep expectations sensible. If you choose numbers this way, think of it as adding variety or fun to the process rather than as a method that increases your odds. Treating the lists with that mindset reduces the risk of taking the patterns more seriously than they warrant.
The real value of these patterns is in their historical insight. They can show which numbers have appeared more or less often over a given period, which can be interesting from a statistical or historical point of view. However, they offer no practical advantage for predicting outcomes, and they should not be relied upon for decision making in gambling.
The next section addresses common misunderstandings about these patterns and clarifies what the data can and cannot tell you. It will help separate useful observations from myths and highlight why responsible play requires recognising the limits of such analyses.
Common Misconceptions About Hot and Cold Lottery Numbers
A frequent misunderstanding is that past frequency creates momentum or debt — that hot numbers will keep appearing or cold numbers are “due”. In reality, repeated past appearances do not make a number more or less likely in future draws, because each draw is random and independent.
Believing in patterns as a way to influence results can lead to poor decisions. The statistics are best used as an informative record: they show what happened, not what will happen. With that perspective, the data can be interesting without encouraging unrealistic expectations.
Now that you know how to interpret the data, the following section explains where to find the most accurate, up-to-date records.
Official Lottery Sources
The official lottery site maintains complete draw histories and frequency charts, updated after every draw. These primary sources are the best place to verify counts and to download full result sets for your own review.
Brand Data and Responsible Play
We also keep our own records of number frequencies and present them in an easy-to-navigate format to help readers explore the data. If play ever stops being enjoyable or becomes a concern, support and advice are available from specialist services such as BeGambleAware.org or the National Gambling Helpline on 0808 8020 133.
Thank you for reading; this full list and the explanations above aim to make Set for Life draw frequencies clear and easy to use as a historical reference.
**The information provided in this blog is intended for educational purposes and should not be construed as betting advice or a guarantee of success. Always gamble responsibly.